#Opening the dashboard
# Start on the default port (3100)
claudear dashboard

# Custom port
claudear dashboard 8080
Then open http://localhost:3100 in your browser.
The dashboard is also available when running claudear start --poll --port 3100.
#What you'll see
The sidebar navigation takes you through every aspect of Claudear's operation:
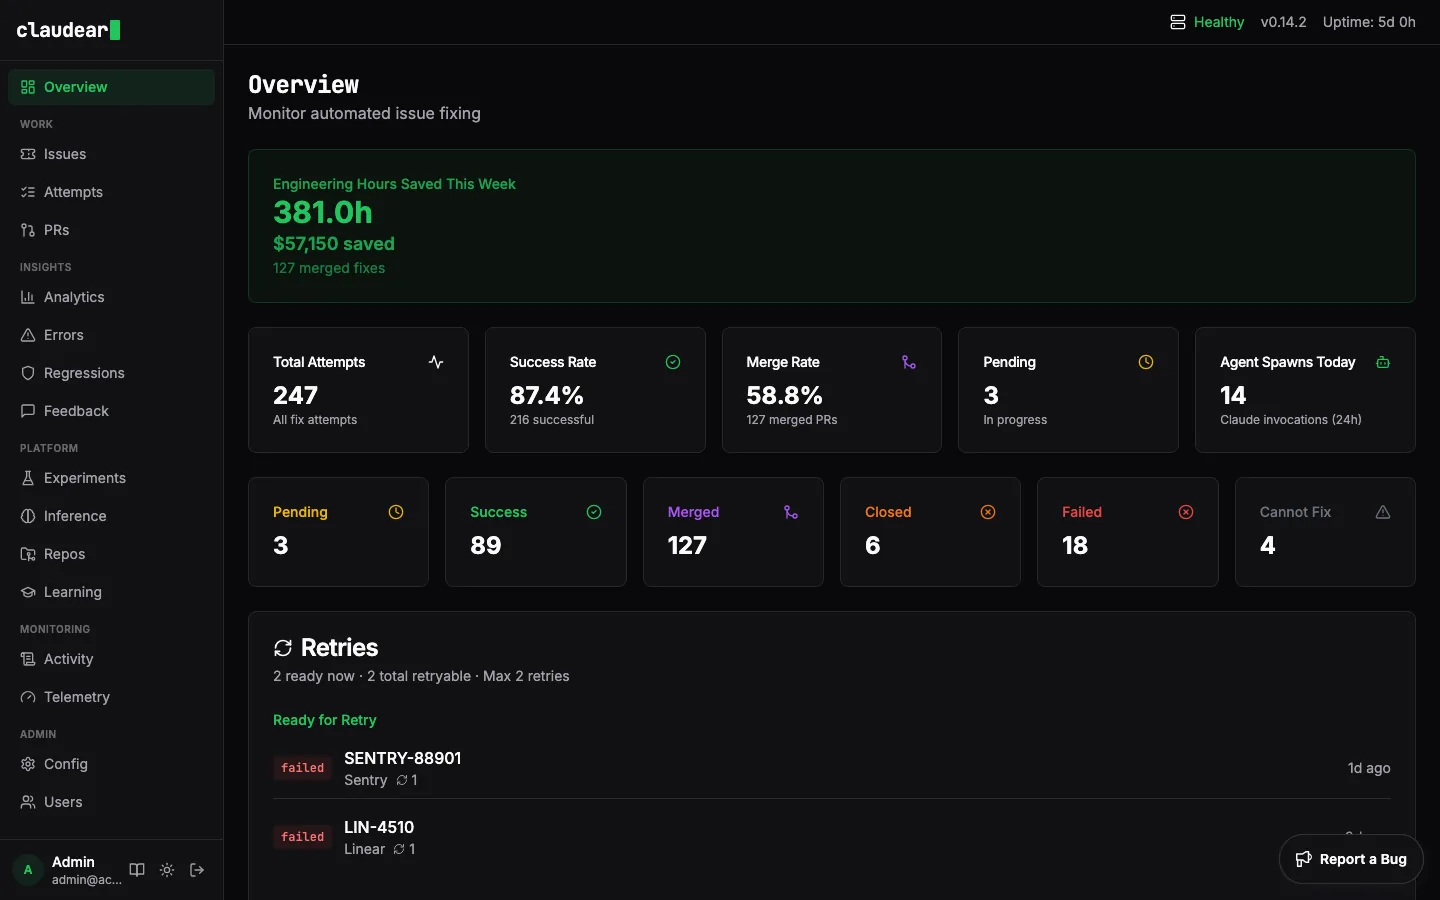
- Overview: at-a-glance metrics: fix attempts today, success rate, active sources, and recent activity.
- Issues: all issues Claudear has ingested across your sources, with current status.
- Attempts: the full history of every fix attempt with status, source, repo, and timing. Click any attempt to see the AI's execution log.
- Pull Requests: every PR/MR Claudear has opened, with merge status.
- Analytics: trends over time: fix rate, merge rate, source breakdown, latency.
- Errors: issues that failed and why.
- Regressions: post-fix monitoring. Flags if an error reappears after a fix was merged.
- Feedback: fix outcomes and user feedback on merged PRs.
- Experiments: prompt experiments for A/B testing agent configurations.
- Inference: how well Claudear is routing issues to the right repo, with confidence scores.
- Repos: repositories Claudear knows about and their indexing status.
- Learning: what Claudear has learned from previous fixes in each repo.
- Chat: interactive code Q&A powered by a local LLM. Ask questions about your indexed codebase using RAG-based retrieval.
- Models: manage local LLM models — view loaded models, download new ones, and monitor inference status.
- Activity: a live feed of everything happening right now.
- Telemetry: system health, poll cycles, pipeline throughput, and queue metrics.
- Config (admin): view and edit your running configuration.
- Users (admin): manage dashboard users and roles.
- Settings: account preferences and theme.
Note: The dashboard is an admin interface. In production, deploy it behind authentication or restrict it to your internal network.
#Screenshots